


We're pleased to announce that we’ve added a Plan Visualizer tool just for MGS Essentials members. When doing agile planning, use this free tool to forecast the likelihood that an agile or Scrum team can complete a certain amount of work within a target number of iterations.
MGS Essentials member? Access the Plan Visualizer tool or sign up today for free.
Sample Agile Forecast
Suppose a team has been asked to complete 240 story points within 8 iterations (marked with a red dot in the image below). The team estimates that its future velocity will fall in the range of 26–34. The numbers (26 and 34) are used to draw the lines showing how much can be delivered.
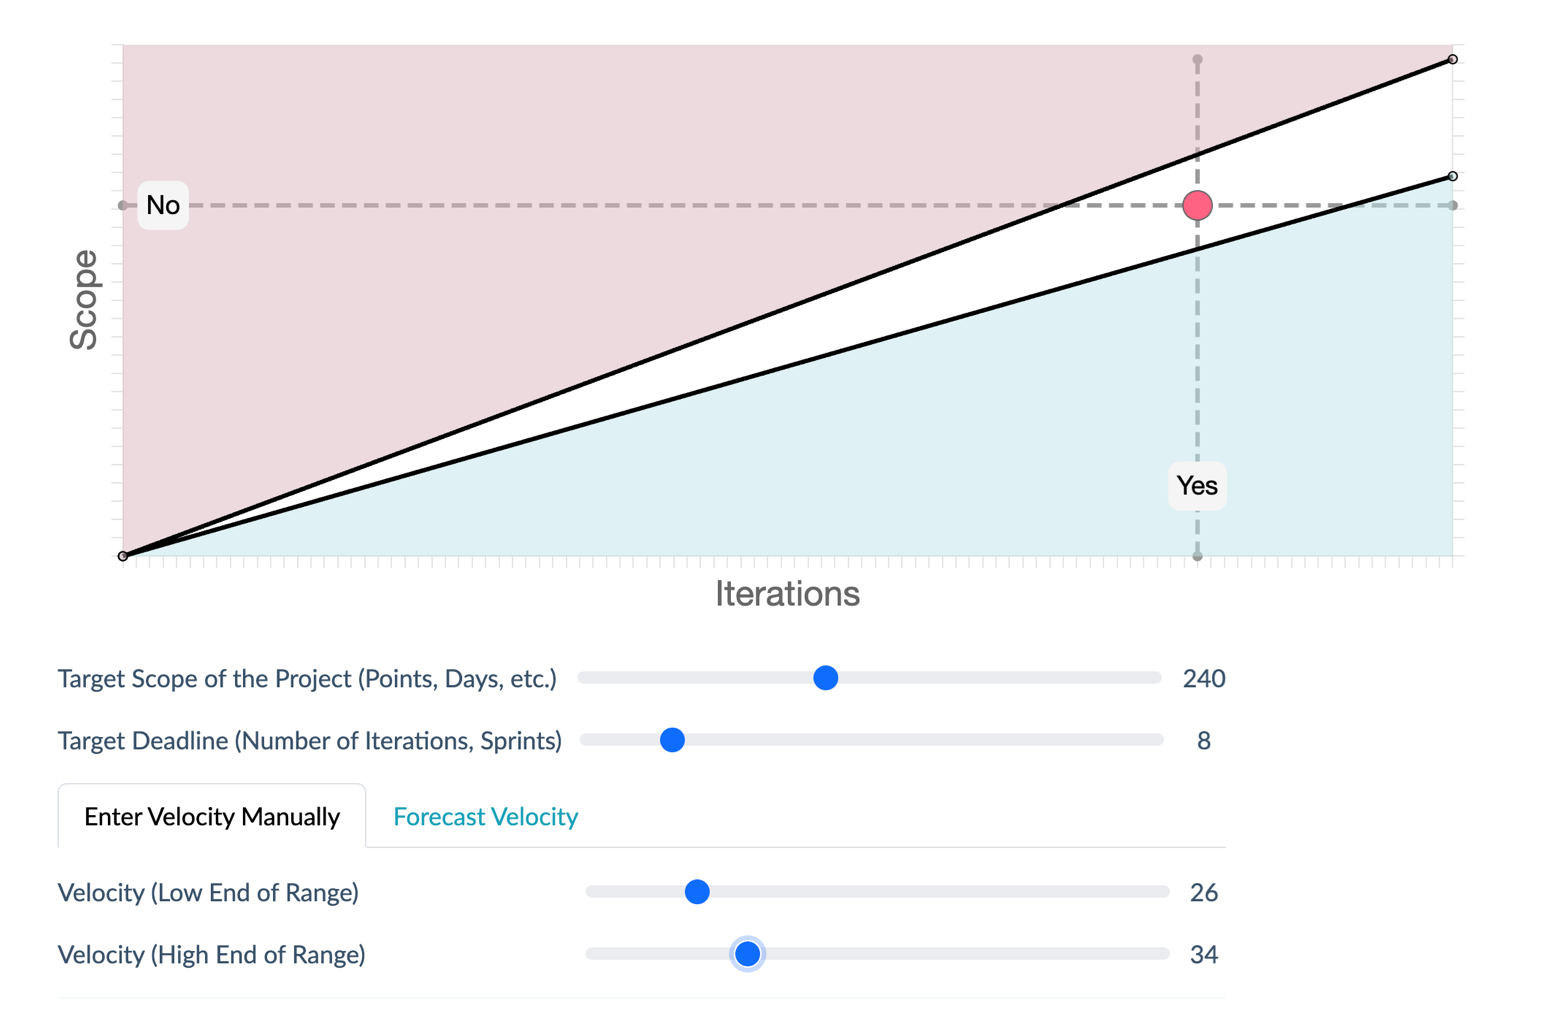 A velocity of 26 for eight sprints will result in 208 points completed; the lower line is below the target of 240 indicated by the red dot. The team’s high-velocity estimate of 34 results in 272 points; that line is above the target.
Because the desired scope falls between what is achievable with the team’s predicted high- and low- velocity estimates, the target is feasible. It’s not guaranteed, but it is achievable.
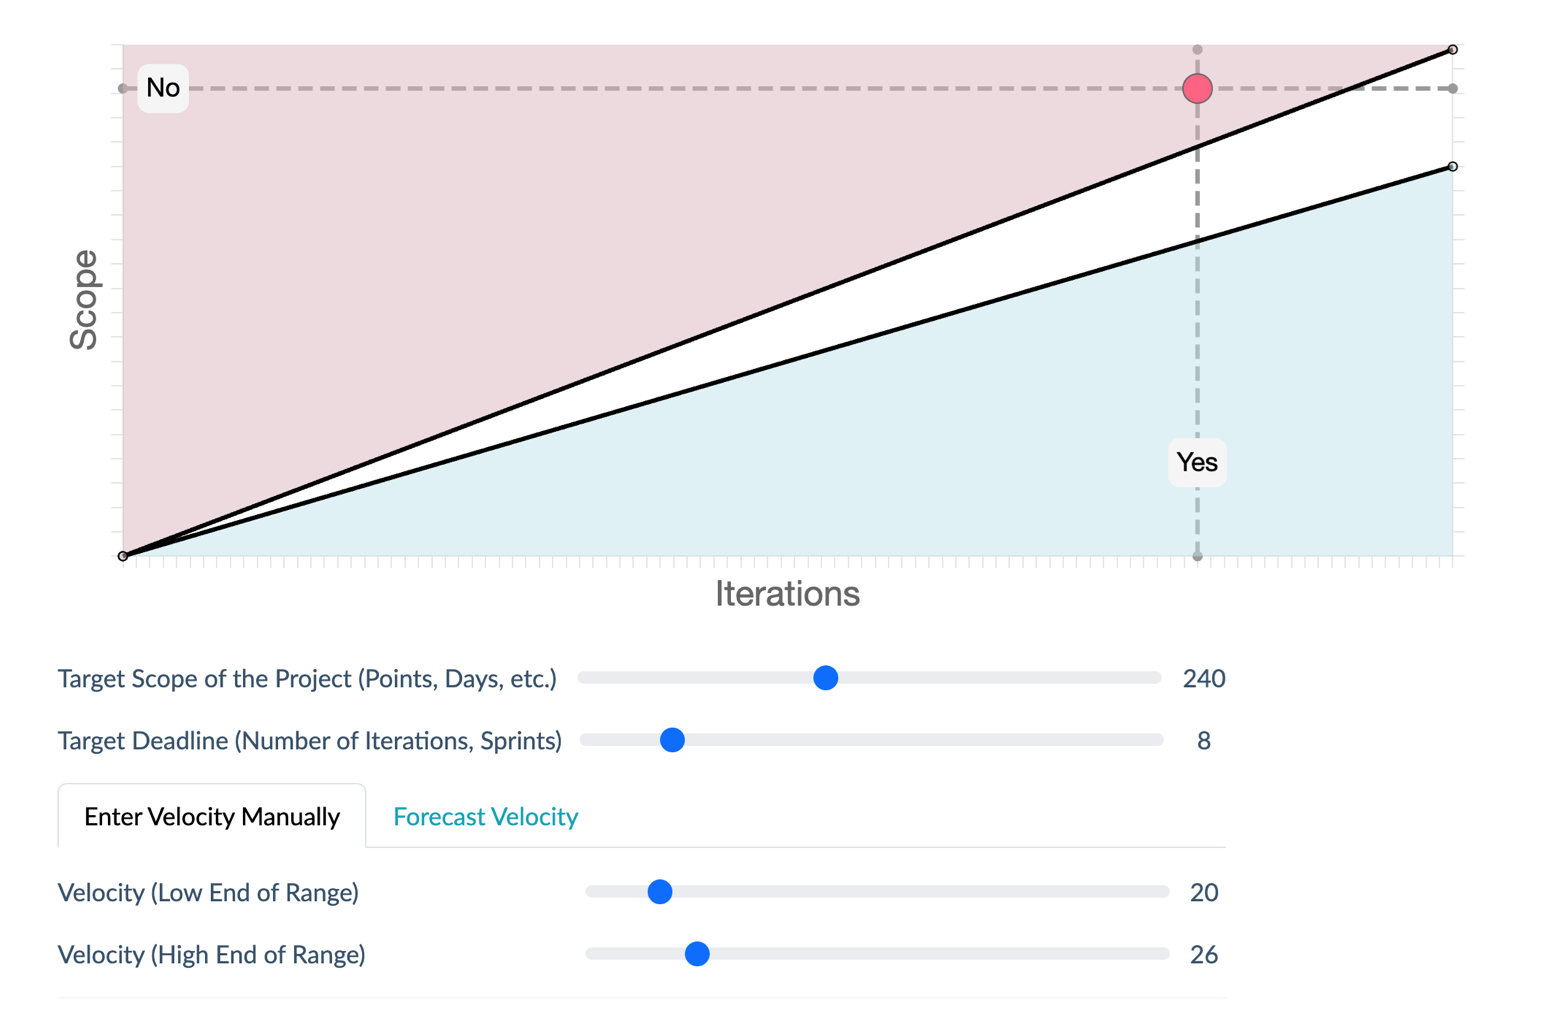
If the team’s velocity range estimates had been lower, say 20–26, the red dot would appear in the red zone, which would indicate that the desired amount of work is not feasible, even at the team’s high velocity estimate.
 Similarly, if the low number in the estimated velocity range is high enough to finish everything, the red dot will be in the green zone. This indicates the target set of work is very achievable.
Communicating with Stakeholders
I use charts like this to answer questions about why certain requests are just not possible.
A chart that shows a set of work and an accompanying target deadline in the red zone makes it clear that, even at the team’s optimistic velocity estimate, the desired work cannot be completed in time. (I don't bother showing the chart if the request lands in the green zone. We just get to work and delight customers by finishing early.)
What If the Forecast Shows We Cannot Finish?
When the targeted set of work and deadline are above one or both velocity estimates, you have a few options:
- Extend the deadline (increase the number of sprints)
- Reduce the scope
- Extend the deadline and reduce the scope
You can use the Plan Visualizer tool to experiment with different scenarios. Increase the number of sprints and see how it looks. Reduce the scope and see how it looks.
Use the tool to collaborate with stakeholders and set the right expectations.
Forecasting Velocity
To determine the viability of a plan, you have to forecast velocity.
The Plan Visualizer allows you to manually enter a velocity range. (You can use another free tool, the Velocity Range Calculator, or a technique called resampling velocity to estimate the velocity range yourself.) Or, if you enter historical velocity numbers, the Plan Visualizer will forecast a range for you.
(If you don’t have any historical data, you can still forecast velocity. This Advanced Topics in Agile Planning presentation shows one way to do that. How to Estimate Velocity as an Agile Consultant shows another)
Let’s take a look at how the Plan Visualizer forecasts a velocity range.
What to Consider When Forecasting Velocity
One of the things you’ll want to know is your team’s mean velocity. To calculate it, look back at as much data as you think relevant; I’d consider a year a good upper limit. A team has likely changed enough in a year that older data won’t be very predictive. (Here’s some advice on predicting velocity if your team changes frequently.)
To forecast a future velocity, you also need to consider how far ahead you are planning. If you’re only planning one sprint ahead, it would be risky to use the team’s average. That is, after all, an average. The team undoubtedly experienced some sprints better than the average and some worse.
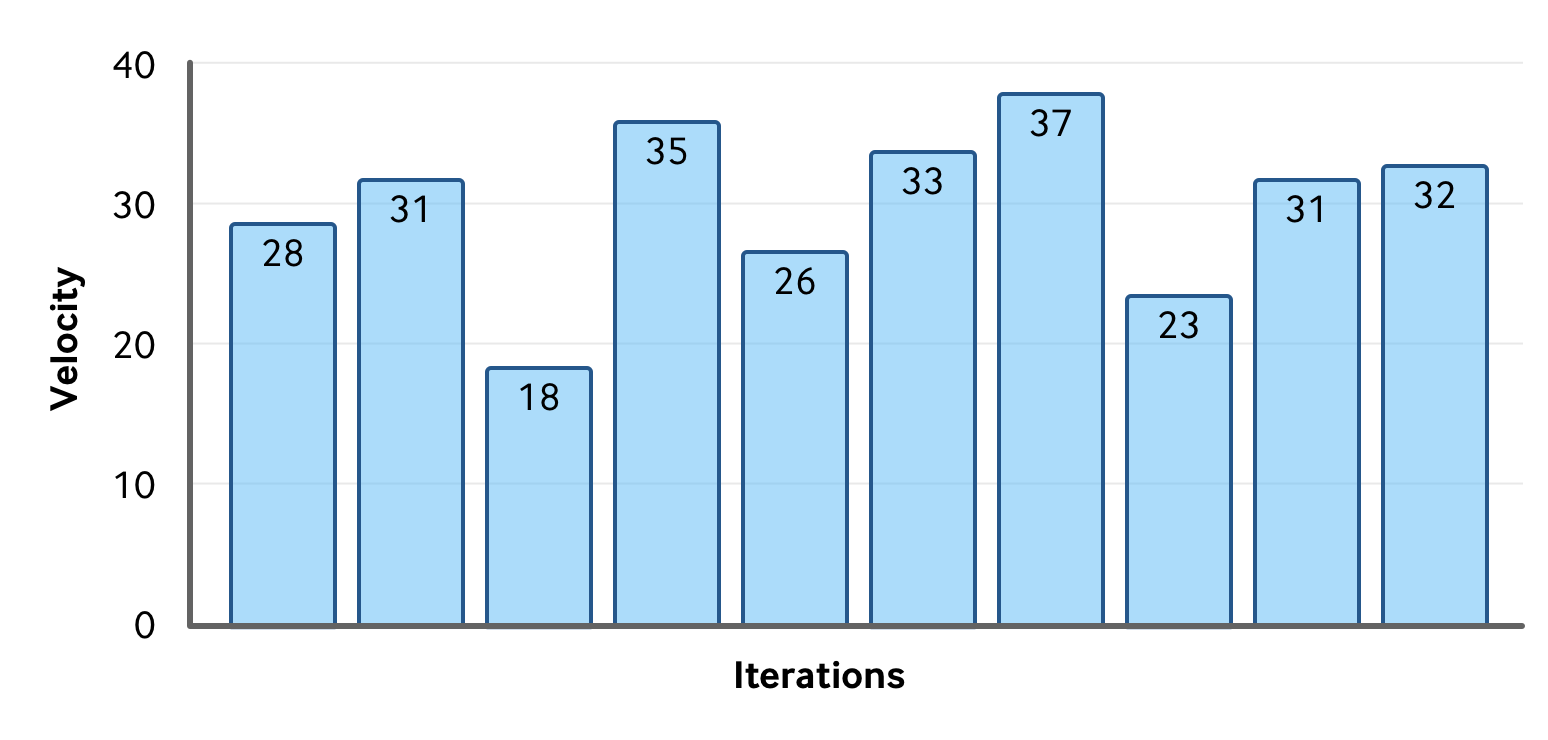
The team in this chart has an average velocity of 29. But in the past, their velocity has been as low as 18 and as high as 37. If they were asked to forecast their velocity in the next sprint, their honest answer would be anywhere from 18 to 37.
But suppose instead they are asked to forecast its velocity over the next 1,000 sprints. With that many sprints, the high and low velocities will balance out. The team can safely forecast that their velocity will be 29, their average.
(I am, of course, ignoring the fact that the team will be learning and improving over 1,000 sprints. And that amazing new technologies will emerge. Well, and also that most of them will probably retire—since 1,000 two-week sprints equals 38 years!)
In sum, to forecast velocity accurately you should use a range. If you’re forecasting only one sprint ahead, the estimate range should be wide. The range can narrow as you look further ahead.
Using a Prediction Interval
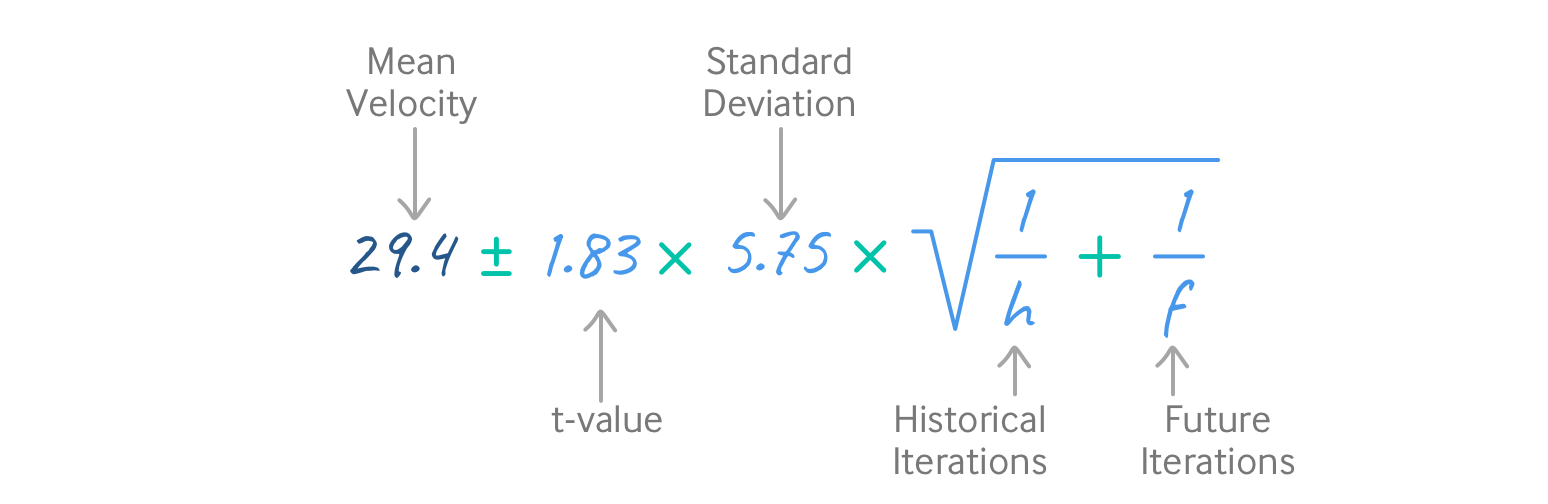
The Plan Visualizer forecasts a future velocity range using a statistical concept known as a prediction interval, which is given by this formula:

That might look complicated, so let me break it down piece by piece.
We start with the team’s average, or mean, velocity. We then add and subtract some amount to that, and that’s everything to the right of the plus-minus symbol. Here’s what that formula means.
What is a t-value?
The t-value is based on how confident we want to be in the plan (we’ll use 90%) and the number of historical velocity values you have. If you had a statistics course in the past, you may remember t-values from that.
The Plan Visualizer calculates the t-value for you. But you can also look up t-values online or use a spreadsheet function.
What is the s in the formula?
The s in the formula is the standard deviation of the team’s velocities. It’s a measure of dispersion. It’s how spread out a team’s velocities are. Teams whose velocity bounces around between 28 and 32 will have a smaller standard deviation than those with a velocity range between 20 and 40.
What are the h and f in the formula?
Underneath the square root sign we have 1 divided by h added to 1 divided by f. The variables h and f represent the number of historical and future sprints.
If, for example, this team has 10 sprints’ worth of data then h is 10. If you’re predicting their velocity for five future iterations then f is 5.
In this case we’d add 1 over 10 to 1 over 5 to get the value under the square root sign.
Prediction Interval Calculation in Action
Before working an example prediction interval calculation, remember you don’t need to do any of this work: the Plan Visualizer will forecast velocity for you.
For our example, I’ll use the velocity graph shown above.
The first step is to calculate the mean and the standard deviation. This is trivial in Excel or Google Sheets. We just use the average and stdev functions.
Doing that, we get a mean of 29.4 and a standard deviation of 5.75.
To get the t-value we use the spreadsheet function T.INV.2T. It takes two parameters. First, the value .10, which indicates we’re calculating a 90% prediction interval. This means there will be a 5% chance the future velocity average will be above our prediction interval and a 5% chance it will be below it. And a 90% chance that the average future velocity will be within the range we’re calculating.
The second parameter T.INV.2T needs is the number of historical iterations you have minus one. We have ten iterations of data, so we use T.INV.2T(.10, 9). That results in a value of 1.83.
Let’s fill these numbers into our equation:
We also know h, the number of historical iterations of data, is 10. And let’s assume this team is being asked to look ahead 5 sprints, which is the value for f. Putting those values into the equation we get:

From here, it’s easy to solve the rest of the equation:

This indicates that over the next five iterations, this team’s velocity can be predicted at somewhere between 29.4 plus and minus 5.68. Adding and subtracting, we get that velocity will be from 23.72 to 35.08.
We want to do our agile estimating in whole numbers. Use your judgment on whether to round up or down for each estimate. I’d say 23.72 is close enough to 24 that I’m going to round that up. The 35.08 is so close to 35 that I’m definitely rounding it down.
If you felt compelled to be very conservative in your answer you could always round both down.
At this point, we can say there is a 90% chance the team’s future velocity will be between 24 and 35.
Forecast with Confidence
You can use it to:
- Set realistic expectations with stakeholders—visually show what’s achievable given your agile team’s velocity.
- Experiment with scope vs. timeline trade-offs—quickly adjust sprint counts and scope to find viable solutions.
- Improve planning accuracy—forecast future velocity using statistical modeling, not just gut instinct.
Log in to start planning with confidence.
Last update: August 18th, 2025